The input of COACH-D 2.0 can either be the sequence or the structure of the query protein. Users can also submit a ligand for docking.
As shown in Figure 1, the COACH-D 2.0 workflow is as follows:
As shown in Figure 1, the COACH-D 2.0 workflow is as follows:
(1) If the sequence of the query protein (monomer only) is provided, the I-TASSER Suite or AlphaFold2 will be used to predict the query protein structure.
(2.1) If the structure is a monomer, it will be processed by five individual methods (TM-SITE, S-SITE, COFACTOR, FINDSITE and ConCavity ) to predict the protein-ligand binding pockets. Four of these methods make predictions by searching the query structure/sequence through the Q-BioLiP and BioLiP template libraries.
(2.2) If the structure is a multimer, it will be processed by the quaternary-based method Q-SITE.
(3) Both template-searched ligands and user-submitted ligand are docked into the predicted binding pockets using the efficient docking algorithm AutoDock Vina.
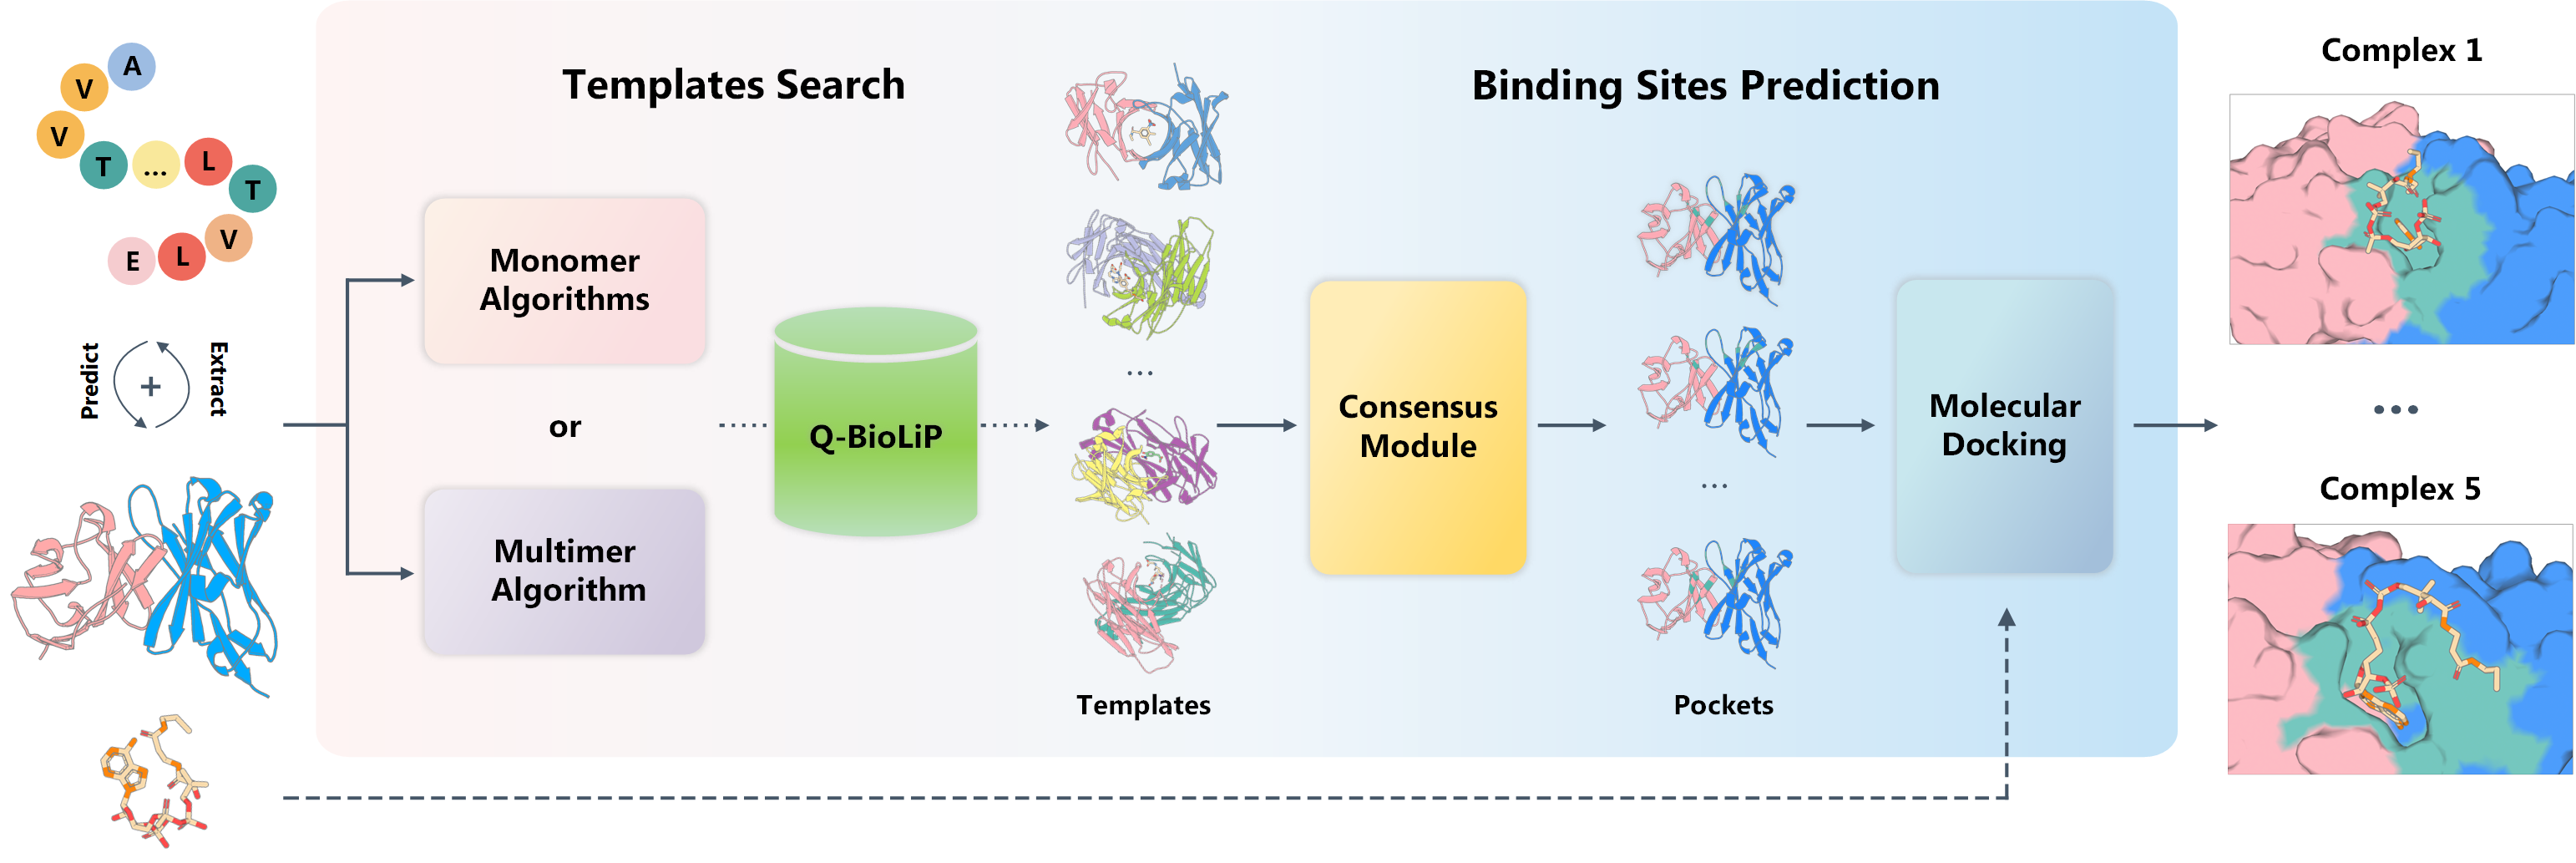
Figure 1. The overall architecture of COACH-D 2.0
Job submission guide:
(1) Paste or upload a query protein. The supported input formats include: Monomeric structure/sequence & Multimeric structure.
(2) Provide the ligand file(optional).
(3) Choose whether to keep your results private.
(4) Submit and reset.
Notice: Due to computing resource limitation, we now allow no more than 10 running/pending jobs per user at the same time.
(2) Provide the ligand file(optional).
(3) Choose whether to keep your results private.
(4) Submit and reset.
Notice: Due to computing resource limitation, we now allow no more than 10 running/pending jobs per user at the same time.
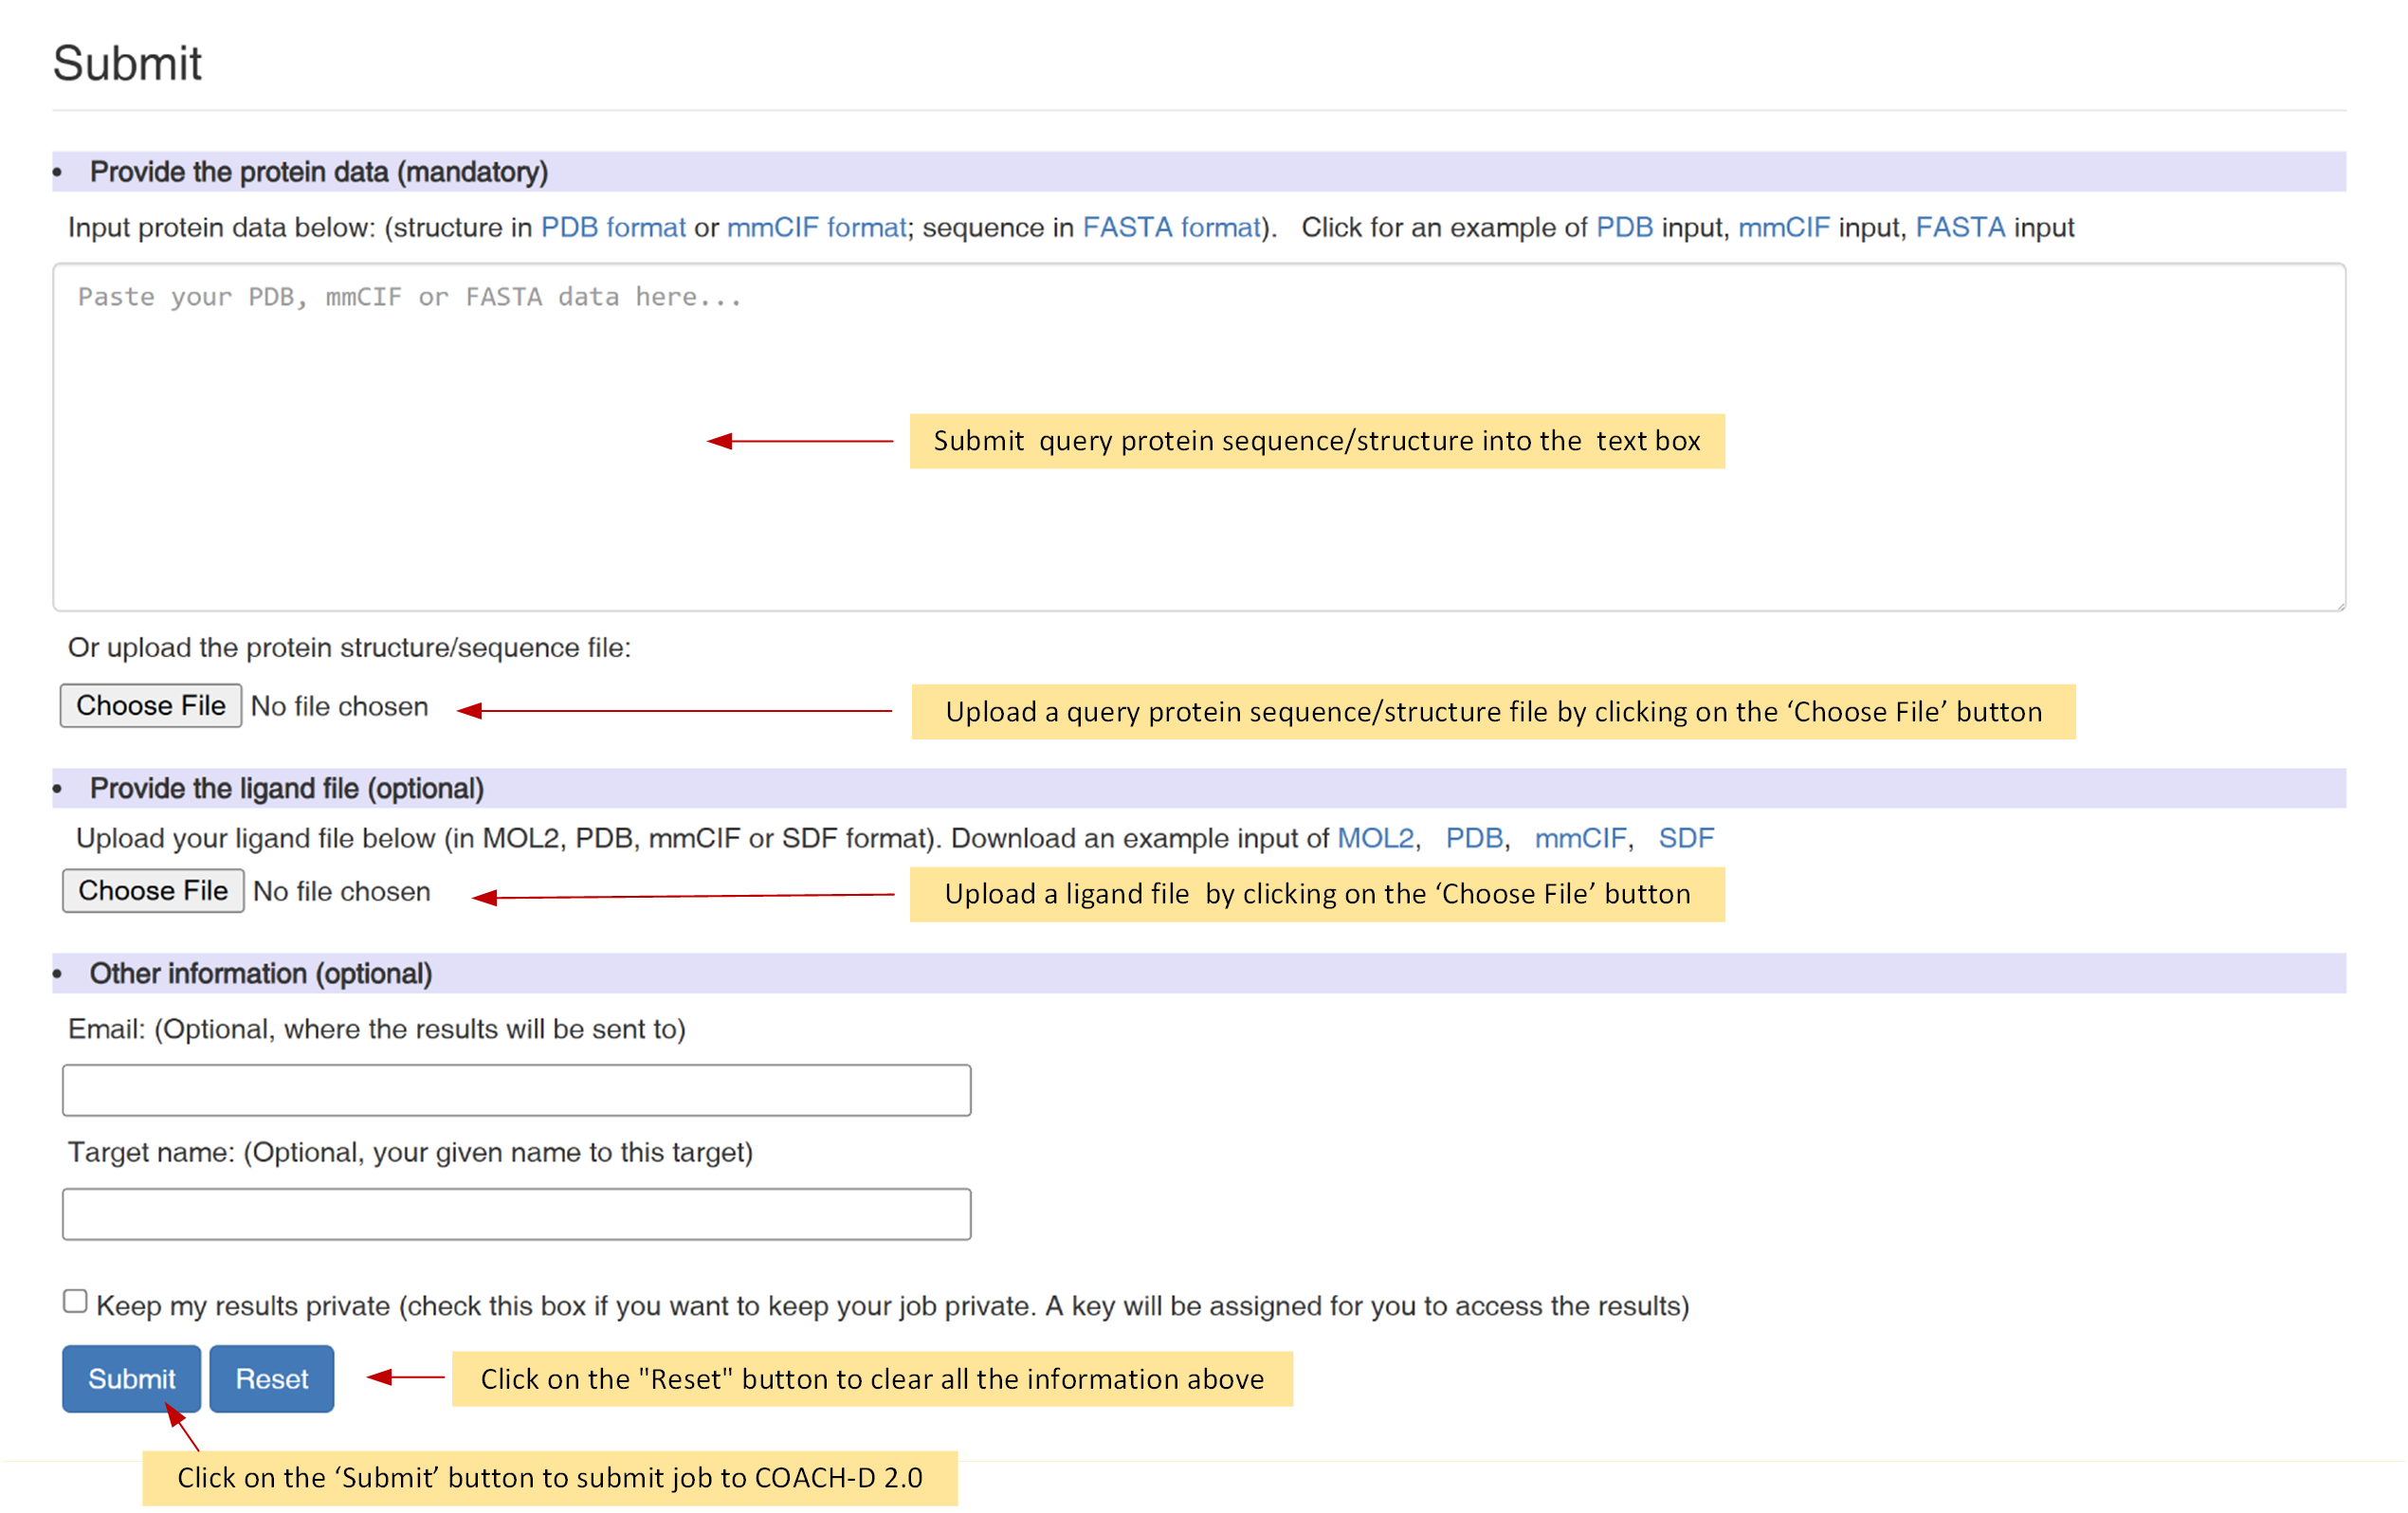
Figure 2. The submission page of COACH-D 2.0
There are separate download links for the following:
(1) The submitted protein
(2) The submitted ligand (optional)
(3) Azip file containing the main results
(2) The submitted ligand (optional)
(3) A

Figure 3. The download link of COACH-D 2.0
The COACH-D 2.0 results are usually summarized in a web page that consists of three sections:
(1) Visualization of each predicted protein-ligand complex structure.
(2) Top five predicted protein-ligand complex structures.
(3) Summary table of potential binding ligands.
(1) Visualization of each predicted protein-ligand complex structure.
(2) Top five predicted protein-ligand complex structures.
(3) Summary table of potential binding ligands.
(1) Visualization of each predicted protein-ligand complex structure.
This section displays the predicted binding of five pockets to the ligand.
Predicted complex structure: Visualization of predicted complex structure.
Current complex Information: The detailed information of the predicted complex on the left side.
This section displays the predicted binding of five pockets to the ligand.
Predicted complex structure: Visualization of predicted complex structure.
Current complex Information: The detailed information of the predicted complex on the left side.
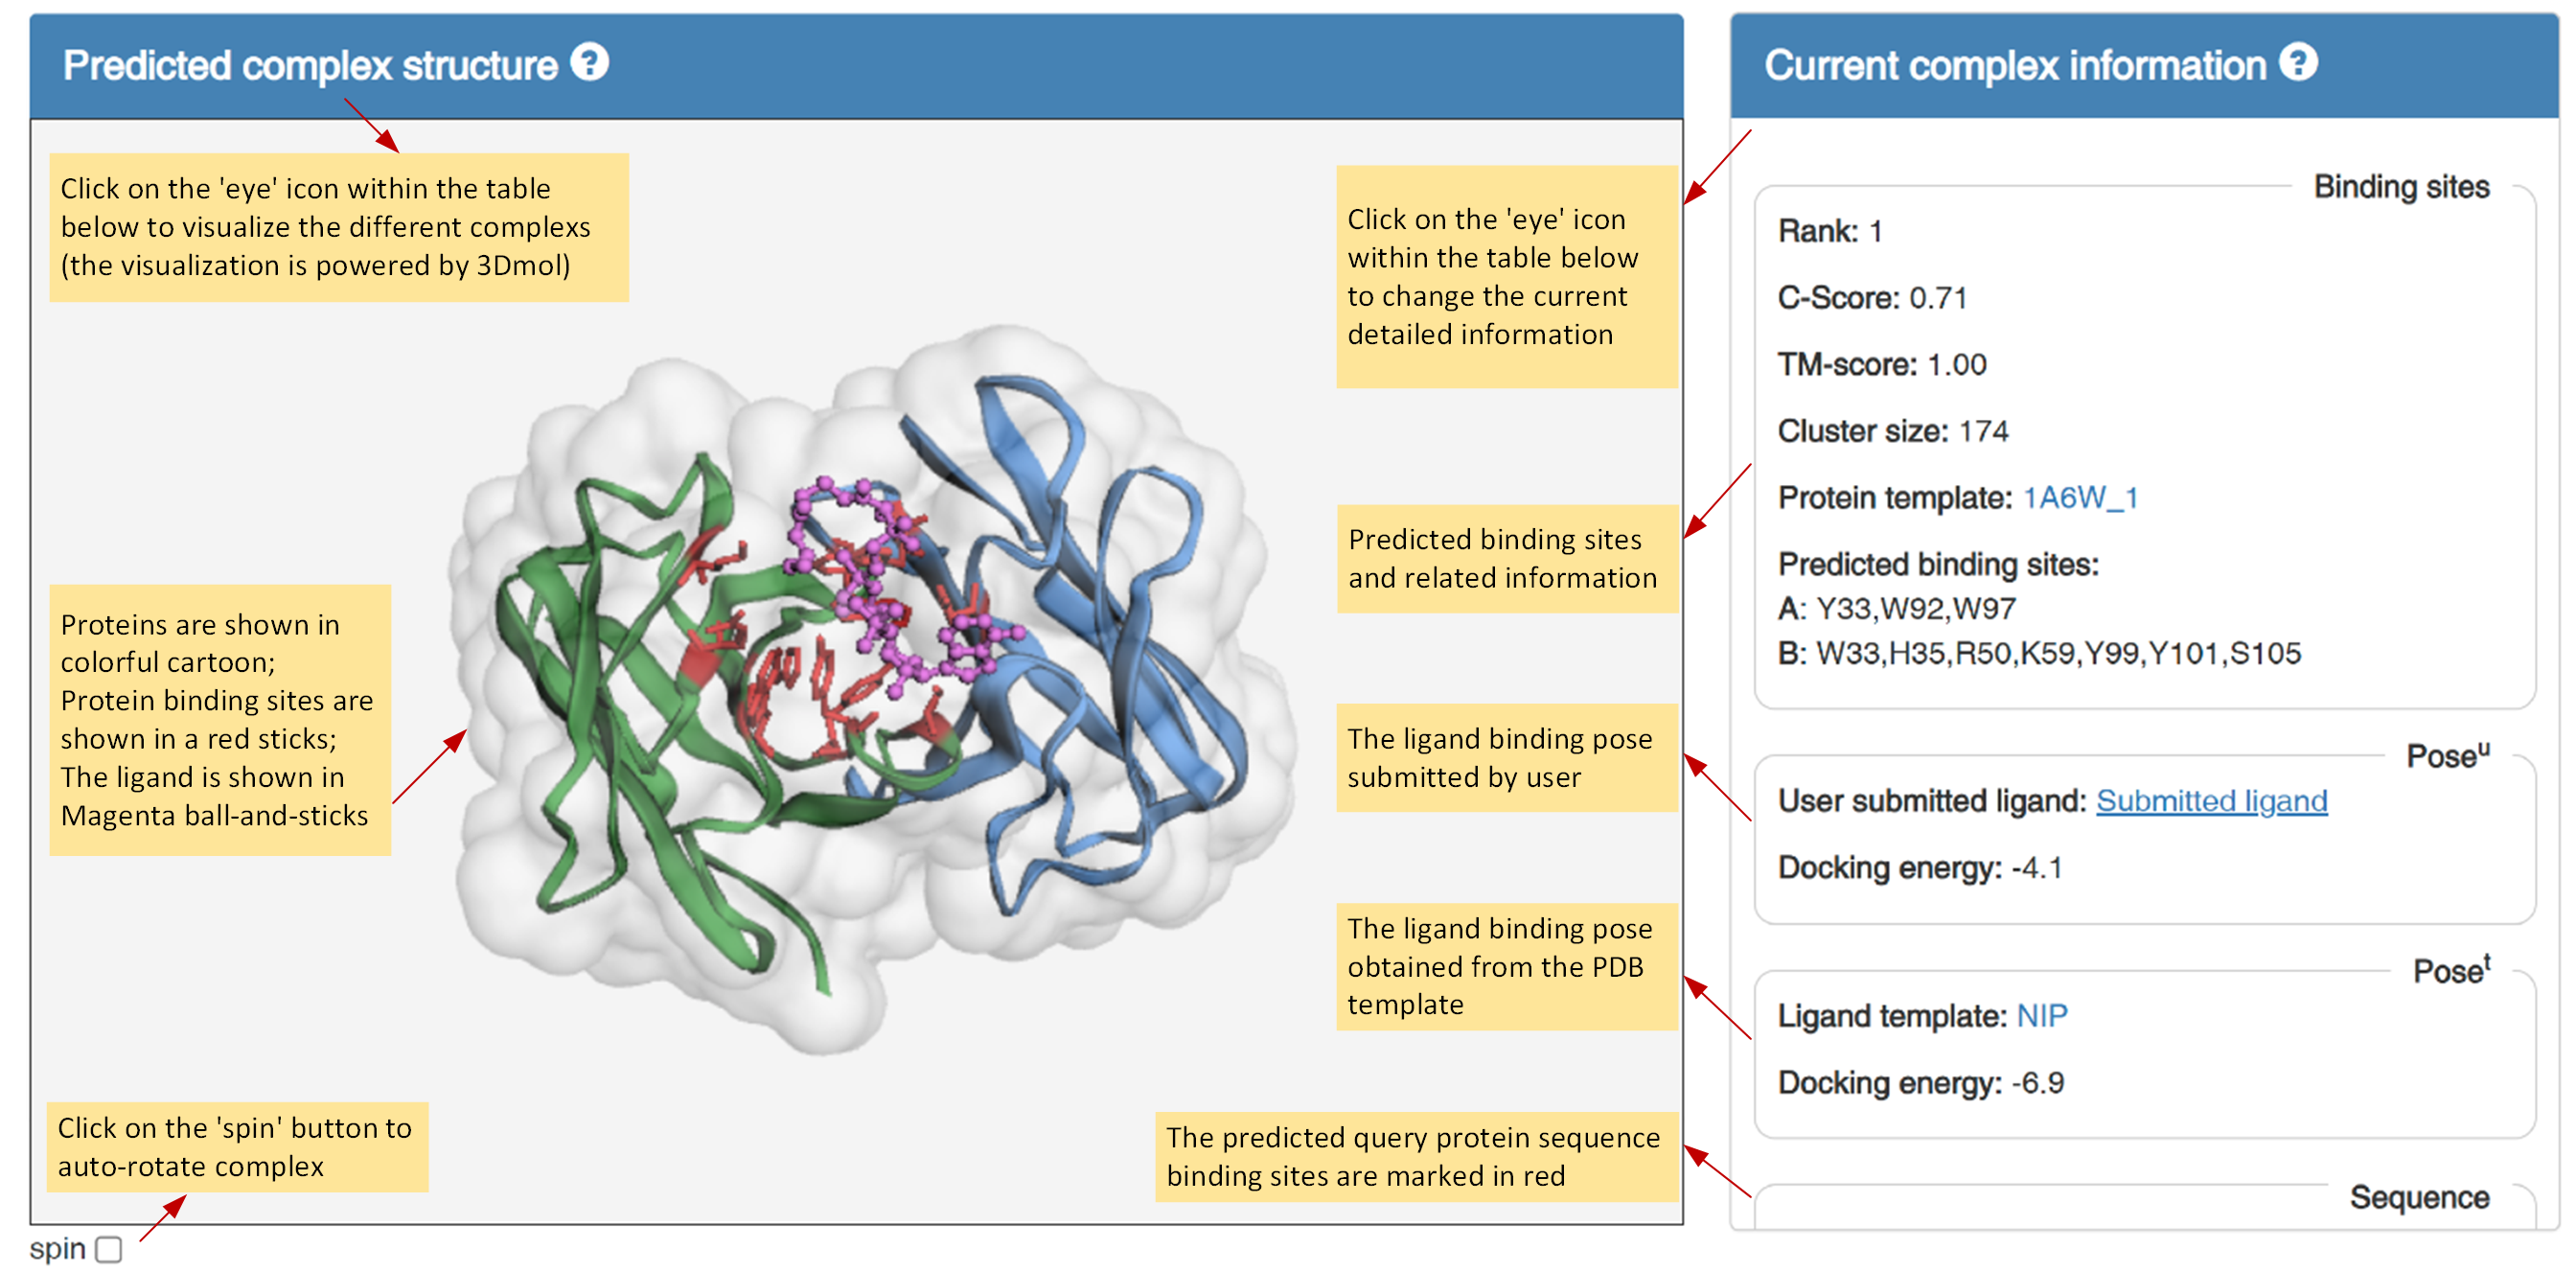
Figure 4. Visualization of each predicted protein-ligand complex structure
(2) Top five predicted protein-ligand complex structures.
This section summarizes the top five predictions in a table.
Rank : The predictions are ranked by the C-Score.
Poseu: The ligand binding pose submitted by user.
Poset: The ligand binding pose obtained from the PDB template.
C-Score: The confidence score of the prediction. C-Score ranges [0-1], with a higher score indicating greater reliability.
Cluster Size : The number of protein template in a cluster.
P Template : The representative protein template in a cluster.
L Template: The representative ligand template in a cluster.
TM-score: The structural similarity between the query and template proteins, normalized by the length of the query protein.
Predicted binding residues: The consensus prediction based on spatial clustering of the predicted binding sites from individual methods.

Figure 5. Top five predicted protein-ligand complex structures
(3) Summary table of potential binding ligands.
This section provides a table summarizing the information about potential ligands predicted to bind the query protein.
Rank: The ligands are ranked by their frequencies in the cluster.
Ligand: Click on the ligand ID to view more information in Q-BioLiP database and click on the download icon to get the corresponding SDF file.
Frequency: The total number of times the ligand occurs in the cluster.
PDB template: The PDB structures of the ligand in the cluster. At most 20 templates are listed for each ligand.
Visualization: Visualizaiton that can be rotated and zoomed in/out with the mouse (powered by 3Dmol).
Others: Other ligands in the cluster. The numbers in brackets are the frequencies. At most 100 ligands are listed.
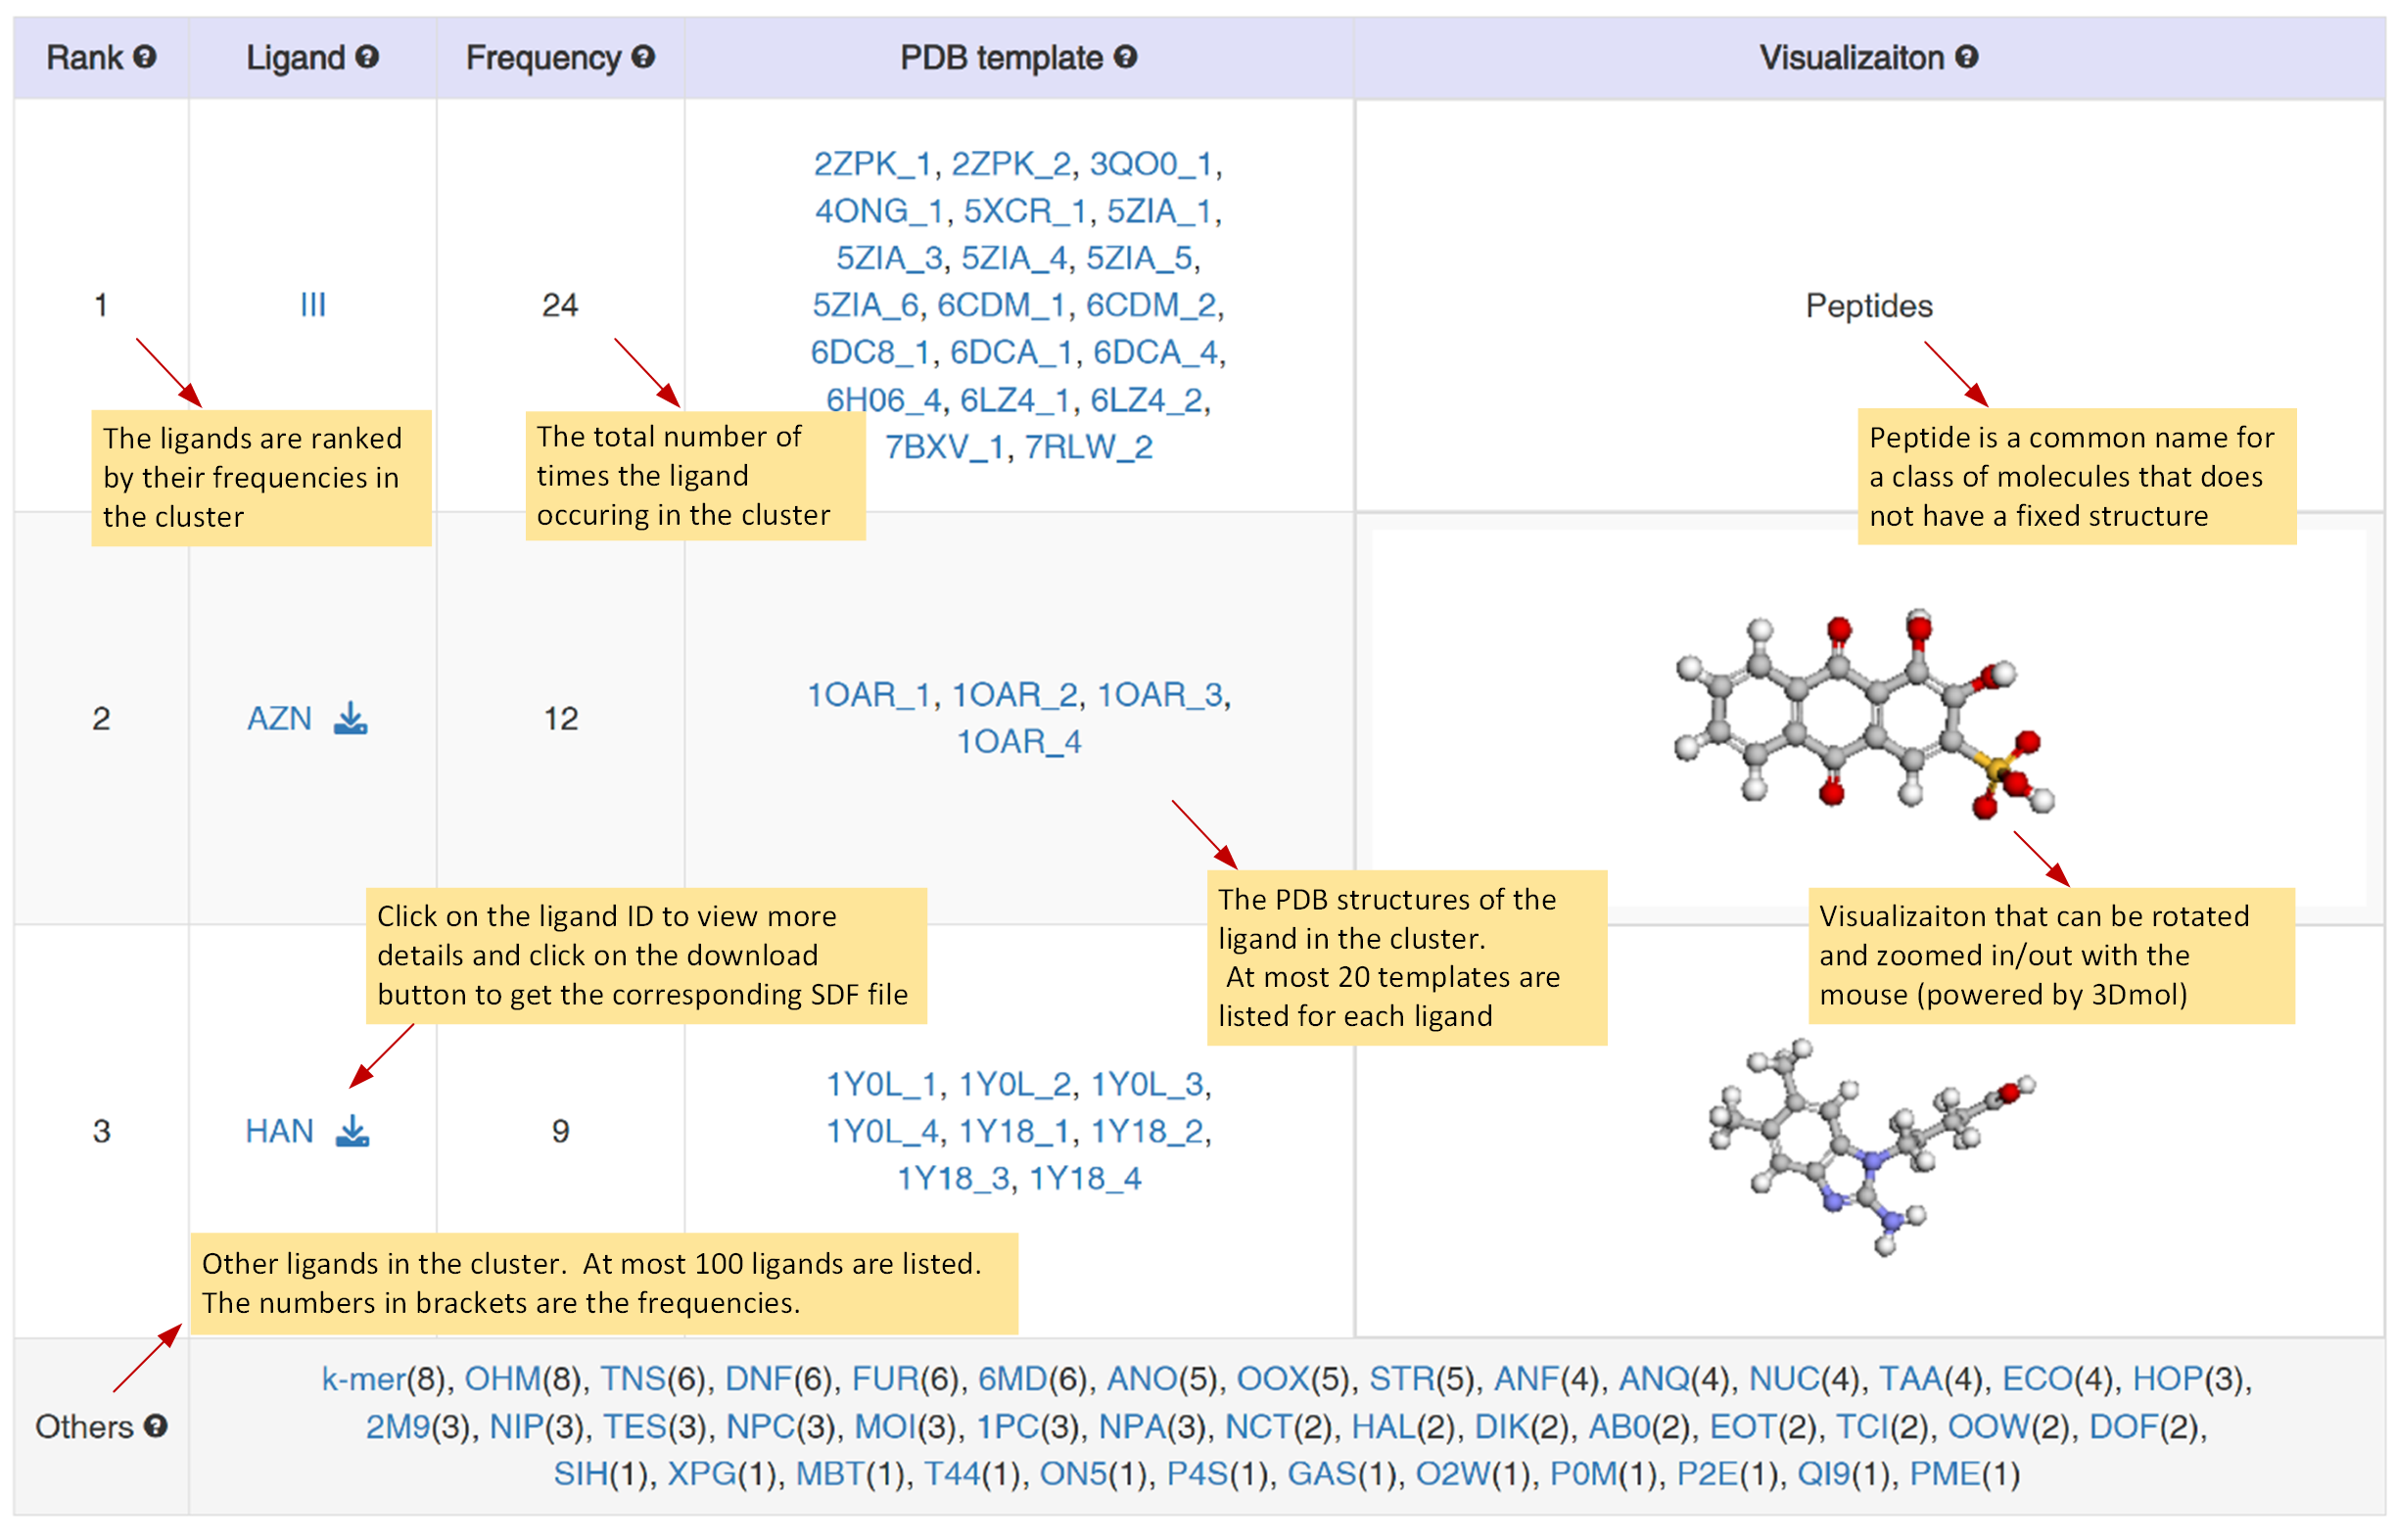
Figure 6. Summary table of potential binding ligands
Please cite the following article when you use the COACH-D 2.0 server:
- An et al, COACH-D 2.0: a server for template-based modeling of protein−ligand interactions, Genomics, Proteomics & Bioinformatics, in press, (2026).
- Wu et al, COACH-D: improved protein-ligand binding site prediction with refined ligand-binding poses through molecular docking, Nucleic Acids Research, 46: W438–W442 (2018).
If you have more questions or comments about the server, please email yangjy@sdu.edu.cn.